Economic and Demographic Context
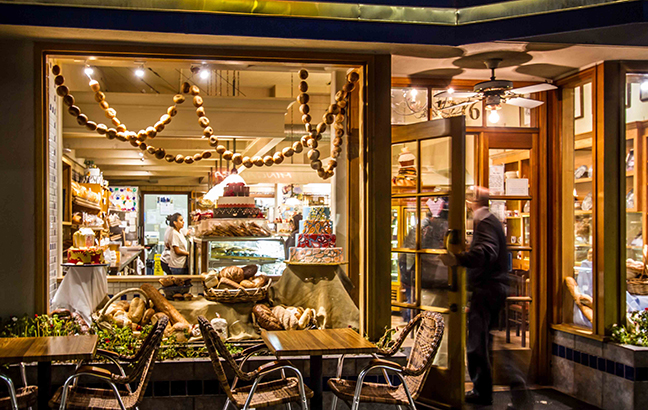
Burlingame supports a strong economy and thriving community, and the City is committed to providing a welcoming environment for a diversity of businesses. The business mix includes a healthy supply of retail, office-based, and hospitality enterprises, as well as light industrial operations. With the completion of significant streetscape improvements to Burlingame Avenue in 2015, the strength of this retail/restaurant/office destination grew.
Historically, Burlingame has had a very balanced distribution of owner and rental households and multifamily/single-family housing stock. However, the growth of the tech economy throughout the region has driven up housing prices significantly. In 2000, the average price of a single-family house in Burlingame was $811,418. By 2010, the average price had risen to $1.32 million, and in 2017, a buyer would have to pay an average of $2.35 million to purchase a home. Monthly rental rates experienced similar dramatic increases. High housing prices create barriers for many people who want to work and live locally, which is a challenge to achieving the City’s goal to remain an inclusive and accessible community. The General Plan includes goals, policies, and programs to bolster and diversify Burlingame’s economic base and promote a variety of housing types to accommodate changing demographics.
A key contributer to the City’s economic success and high home values is the high quality of both public and private schools. The reputations of the Burlingame School District and San Mateo Union High School District attract families who engage extensively in local civic life.
Regional Issues
The San Francisco Bay Area is expected to experience continued economic and population growth through 2040, fueled by the innovation economy and its reputation as a desirous place to live and work. With its location on the Peninsula, Burlingame is amidst some of the strongest economic growth in the region. This growth has resulted in a sizable increase in new jobs, but communities throughout the area have had difficulty providing additional housing to keep pace with job growth. In this context, Peninsula communities, including Burlingame, have wrestled with how this regional growth dynamic relates to their local communities.
Population Trends
In 2016, the California Department of Finance reported Burlingame’s population at 29,724 residents. The City’s population generally has grown at a slower pace than in surrounding Peninsula cities, some of which have had vacant land or more urban-focused land use policies to accommodate new development. Burlingame grew by approximately 7.5 percent between 1990 and 2010, while the surrounding area grew by over 10 percent.
Although Burlingame’s population grew slightly from 1990 to 2010, the number of households remained nearly flat during this period. This can be attributed to the average household size having increased, partly explained by the growth in family households with children. The percentage of Burlingame households made up of families with children increased from 25 percent to 29 percent between 2000 and 2013.
Age
The age distribution of Burlingame residents suggests a demographic shift toward more families with children and also, similar to shifting demographics nationwide, a higher percentage of senior residents. The increase in families can be explained by the high quality of local schools and home sizes that can accommodate more people. The aging population reflects the fact that people are living longer and prefer, when they can, to stay in Burlingame during their retirement years.
Income
Median household income in Burlingame is similar to the surrounding cities and county; however, the City has higher shares of households in the highest and lowest income brackets. This may be due to the diversity in the housing stock (an almost 50/50 split in multifamily versus single-family and renter versus owner).
Tenure and Housing Stock
Burlingame has a higher share of renter households and multifamily housing units than San Mateo County as a whole, providing more diverse housing options. Nearly half (49.7 percent) of Burlingame’s housing units are in multifamily structures, which is higher than in San Mateo County as a whole (42 percent). Fully 53 percent of units in Burlingame are renter-occupied, compared to 41 percent in the county.[1]
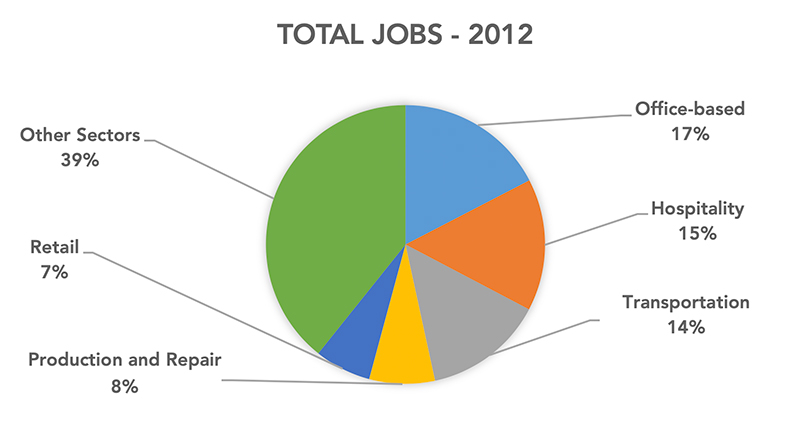
Employment
More than half of Burlingame residents who work drive to employment locations in San Francisco and nearby Peninsula communities.
Burlingame has a relatively high ratio of jobs to employed residents compared to San Mateo County as a whole. According to the U.S. Census Longitudinal Employer-Household Dynamics, as of 2011 there were approximately 2.5 jobs in Burlingame for each employed resident. Countywide, this ratio was 1.00.
[1] 2015 American Community Survey